The Stock Market is thrilled – You should not be …

Happy Face

In case you were hoping that America’s three-decade-long trend toward extreme wealth inequality was starting to reverse itself, Pew has some bad news for you.

Nothing has changed.

The rich are still getting richer… and everyone else is still getting hosed.

Today’s monthly job report reinforces that fact.

Out of the marvelous 204,000 new jobs “Leisure and hospitality employment rose by 53,000 in October.  Within the industry, employment in food services and drinking places increased by 29,000, the same as its average monthly gain over the prior 12 months.

Employment in retail trade increased by 44,000 in October, compared with an average monthly gain of 31,000 over the prior 12 months.”

In other words of the 204,000 new jobs 97,000 were in low  paying positions.  Most of these jobs pay less than $15.00 an hour.  At $600 per week (15 x 40 hours) their total annual income is $31,200.  That number is below middle class.  Those in the $10 to $12 hourly pay rate are clearly part of the poor.

So celebrate the number of new jobs if you must.  Just realize that this society is creating a nation of poor people.

Wal-mart is making money and so are the owners of corporate stocks.

America’s Standing is at Stake

I wrote I would not spend time listening to all the talk about government shut down and debt ceiling but the talk and news reports are everywhere.

I am really becoming frightened by the threatened default of the U.S. government.  You see reneging on its debt obligations would make the U.S. the first major Western government to default since Nazi Germany 80 years ago.

Germany unilaterally ceased payments on long-term borrowings on May 6, 1933, three months after Adolf Hitler was installed as Chancellor. The default helped cement Hitler’s power base following years of political instability as the WeimarRepublic struggled with its crushing debts.  We all know where that led.

Today we are faced with have similar situation.  A small group of congressmen (the Tea Party) have taken control of the Republican Party and consequently are holding the government hostage.  They want to stop government borrowing and paying out only from the revenue received.  The Tea Party members do not believe that there will be any consequences to a default.  If only I could get away without not paying back my loans and meeting my commitments.

Will we see chaos in America that leads to a dictator in the name of stability?  Dictators frequently need a scapegoat.  Will it be the Jews?  Perhaps they will blame Hispanics and specifically Mexicans as the result of the influx of illegal aliens.

I predict that a default on America’s commitments will reduce this country’s credibility.  The world is on a de facto dollar standard, similar in some respects to the British pound sterling standard of the 19th and early 20th century.  The U.S. dollar will not be the world’s reserve currency if there is a default.

The Richest 1% Own Nearly Half of all Global Wealth

By David Lazarus, Los Angeles Times, October 11, 2013

David Lazarus, Los Angeles Times

The richest 1% own nearly half of all global wealth.

Let’s get our heads around that. Only a tiny fraction of the roughly 7 billion people in the world accounts for 46% of the estimated $241 trillion in money, prop­erty and other material resources available.

The richest 10%, mean­while, can claim 86% of global wealth, leaving 90% of the world’s population to divvy up whatever’s left.

These extraordinary figures were included in a report this week from Credit Suisse Research Institute. It found that the gravy train is chugging along, but with relatively few passengers.

Former Labor Secretary Robert Reich has been sounding the alarm over wealth inequality for years. He’s at the center of a recent documentary, “Inequality for All,” which explains the problem in frightening detail.

“When so much of the purchasing power, so much of the economic gain, goes to the very top,” Reich told me, “there’s simply not enough purchasing power in the rest of the economy.”

That has profound impli­cations. In the United States, consumer spending accounts for about 70% of all economic activity. If most consumers are getting by with less, the inevitable outcome is that they’ll have fewer dollars to pump into the economy.

Reich noted that wealth inequality was greatest in this country in 1928 and 2007. In both years, the top 1% represented about a quarter of total income.

And shortly thereafter, in 1929 and again in 2008, the U.S. economy tanked, drag­ging down the rest of the world with it.

Other nations, Reich said, have taken steps to address wealth inequality. They’ve invested more in infrastructure and educa­tion in an effort to create more economic opportuni­ties throughout the social spectrum.

The United States, for its part, has been content to let the problem grow.

“We are far more unequal than any other advanced society in the world, and we are surging toward greater and greater inequality,” Reich said.

The Credit Suisse report bears that out. Average adult wealth in Switzerland is $513,000, the world’s high­est, followed by Australia ($403,000), Norway ($380,000) and Luxembourg ($315,000).

Ford Factory - 1913

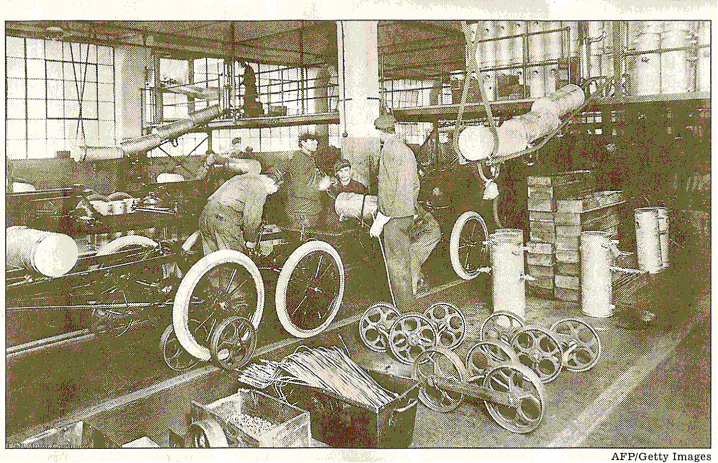
IN 1914, HENRY FORD more than doubled factory workers’ minimum pay so they could afford to buy Ford cars. Above is the Highland   Park plant in 1913.

——————————————————————————————————

Average adult wealth in the United States is $301,000, but that number is heavily skewed by the fact that this country has, by far, the greatest number of “ultra-high net worth” indi­viduals, with personal as­sets exceeding $50 million.

According to the report, the United States accounts for 46% of all such super­wealthy people worldwide. Coming in a distant second is China, which boasts 6% of the world’s super rich.

Being successful, obvi­ously’ isn’t a bad thing. There’s much to be said for the whole land-of-opportu­nity idea, in which people are rewarded for a job well done.

But that’s not what’s actually happening. The rich are gaming the system so they can accumulate a greater share of wealth to the detriment of others.

They do this by using their financial (and hence political) clout to reduce their share of taxes, thus placing a greater burden on the rest of society to fund government programs and the public sector’s investment in economic growth.

The top marginal tax rate for much of the 1920s was 25%. It was 35% in 2007. At both times, wealth in­equality was at record levels.

Compare that with the 1950s when, under then­ President Dwight Eisen­hower, a Republican, the top marginal tax rate was 91%. Were the upper classes barely scraping by with such an onerous tax load?

Hardly. This period was one of the most prosperous in American history. Not coincidentally, wealth in­equality was at a low as almost everyone shared in the economy’s and the country’s good fortune.

In contemporary terms, job creators were paying much higher taxes than working stiffs, and – guess what? – there were still plenty of jobs being created.

“I’m sure the rich in the 1950s would have preferred a 10% tax rate,” said Gregory Clark, an economist at UC Davis. “But there’s no em­pirical evidence that taxing the rich slows down eco­nomic growth.”

Just the opposite. Since consumer spending is re­quired for growth, placing more money in the hands of consumers would seem crucial to fueling economic expansion, which, it goes without saying, has the ancillary benefit of helping the rich get richer.

Henry Ford recognized this. In 1914, he more than doubled factory workers’ minimum pay to $5 a day ($1l7 in today’s dollars). In part, this was to halt costly employee turnover. But it was also to provide workers with enough cash to buy the cars they were making.

“It is our belief that social justice begins at home,” said James Couzens, Ford’s treasurer at the time. “We want those who have helped us to produce this great institution and are helping to maintain it to share our prosperity.

“We want them to have present profits and future prospects,” he said. “Believ­ing as we do that a division of our earnings between capital and labor is unequal, we have sought a plan of relief suitable for our busi­ness.”

U. S. chief executives made an average of$12.3 million last year, or 354 times what the average rank-and-fIle worker pulled down, according to the AFL-CIO. Thirty years ago, the average CEO was paid 42 times what ordinary workers received.

The Credit Suisse report shows that the number of millionaires worldwide has risen by almost 2 million since the middle of last year. There are now about 99,000 individuals worth more than $50 million apiece.

Yet two-thirds of all other adults have assets worth less than $10,000. Put another way, two-thirds of all adults worldwide repre­sent no more than 3% of global wealth.

Credit Suisse forecasts that global wealth will rise almost 40% over the next five years. That’s the good news.

The bad news is that you, and billions of other hard­working people, will see little if any of those gains.

What is Middle Class?

$100,000 annual income is not middle class!

When people with that kind of income claim to be middle class they have grown accustomed to a different living style.  They simply cannot relate to those of us in the middle class.

ABC News brought up the subject last night (August 6, 2013).  However, after asking the question, Diane Sawyer provided no answer.  It seems to have evolved from comments by the president.  He too did not define middle class.  ABC did offer some measurements on its website.

Their take is your income must be at least $32,900 per year for a family of four that includes two children.  The upper limit, they say, is $64,000.  The median household income in the United   States was $52,029 in 2011 so this range appears to be reasonable.  The US government considers the poverty line at $23,550.

San Fernando Valley - Typical Middle Class Home
San Fernando Valley – Typical Middle Class Home

So when your brother-in-law pulls into your driveway with a new Lexus and lives like money is no problem he is one of the lucky few.

“Taper” and “Sequester” both Wall of Strength?

“Taper” may be easier to define (and spell) than “sequester” but both caused the same headache for financial markets.

“Taper” is the latest buzzword that describes the Federal Reserve’s pledge to gradually drawdown the ultra-loose borrowing conditions fueled by its bond buying (the Fed’s demand drives up bond prices and drives down borrowing rates pinned to those bonds). “Sequester” you’ll remember was the S-word that emerged from federal budget-balancing attempts. It had investors bracing, however briefly, for an expensive and inconvenient government service disruption. Words can be potent once they’ve entered the investing vernacular. We get it. It’s noise that can be hard to tune out. And who wants to turn a deaf ear when our portfolios are at stake? Frankly, the negative use of the word “tapering” has muddled the fact that the Fed is simply readying for actions that most investors have expected for some time—which ironically, are tailored responses to an improving economy.

Stock Market Jitters in 2013

The formidable line here is an uptrend. The S&P 500 closed at an all-time high 1,669.16 on May 21, 2013, up over 130% from its financial-crisis low of 676.53 reached March 9, 2009, but it wasn’t a straight path to that high. From election uncertainty to fiscal-cliff vertigo to rumblings from Europe, and now, intense focus on the Fed–we’ve been here before. Data source: TD Ameritrade/Standard & Poors.

Of course there are no guarantees.  Today panic seems to be in the air.

Investing in Gold

A year or two ago there were non stop ads on radio and television promoting the purchase of gold.  The primary thrust of the messages was that the United   States and perhaps the rest of the world was on the verge of massive inflation.  The only protection of your wealth is gold ownership was the drum beat argument.

I did buy a few thousand dollars of GLD shares.  I bought and sold the shares twice. In that time my net profit was about zero.  I decided sticking to stocks and bonds was a wiser plan after receiving a caution call from the stock broker that handled those trades. That was 2011.

With all the talk about declining value of gold I decided to plot its movement in relation to the movement of the S&P 500 starting January 1, 2013.  My source for the data is the Yahoo Finance graphing tools.  As you can see on the linked graph the S&P 500 has increased in value about 14% while GLD gold shares have dropped about 14%.

What happened to inflation and its effect on the price of gold?  Someone will have to explain it to me.  I do know one man who said the bubble will be bursting soon.

Anyone care to comment?

You Can Be Richer Too!

Stupid articles and papers telling us the obvious wastes our time.  Businessweek featured such a totally wasteful piece discussing someone named Justin Wolfers, a University of Michigan professor, who wrote an article titled “Economists Nail It: You Can Never Be Too Rich.”  Do I need someone to tell me that it is better to be rich than poor?  Even the reporter, Peter Coy, who is a primary commentator/reporter for the magazine offered the obvious remark, That may seem to deserve a Homer Simpson “Duh!” award for most obvious research finding of the month.  So why even post this report?  The answer must be that he has space to fill.

This has been a great year to be just a little bit richer.  If you were already rich you might have become a lot richer.

In just the four months of this year the Dow Jones Average increased by 14.3% and the S&P 500 increased by 13.2%.  Understand that you did not have to be particularly smart to choose the right stocks to have earned that money.  You simply had to buy an S&P 500 index account and your $1,000 would now be worth $1,132 today.  If that investment had been $10,000 you could sell your gains now and have $1,320.  Enough to buy that new giant TV or pay down a burdensome credit card.

So what’s the problem.  “Your Money” reported that 55% of the people surveyed did not believe this has been a good time to invest.

So when is a good time?

You see article after article crying about the wealth gap between the rich and everyone else.

Sad to say it but the average man on the street is unwilling to take the chances that the rich take.  Perhaps that is one of the reasons you may never be rich.

Social Security is a Promise that will be Hard to Keep

Chained CPI is only the beginning of many other factors that will limit future payout.

Here is an unpleasant fact about Social Security.  The system was designed in the 1930s. Life expectancy at birth in 1930 was indeed only 58 for men and 62 for women, and the retirement age was 65.  Reported in USA Today, Social Security’s original retirement age of 65 was set in 1935 when life expectancy was 63. Today, life expectancy is 77 — and, for those who live to 65, life expectancy is 83. The system used to benefit financially from people who paid Social Security taxes but died before collecting any benefits.

When Social Security  was implemented almost 54% of men could expect to live to age 65 if they survived to age 21, and those who attained age 65 could expect to collect Social Security benefits for almost 13 years (and the numbers are even higher for women).  Men attaining 65 in 1990 can expect to live for 15.3 years compared to 12.7 years for men attaining 65 back in 1940.  This is data supplied by the Social Security Administration.

Some of the data is murky and can be interpreted to support your particular views.

I entered all of my Social Security contributions for my entire working years. I then calculated their future value in an Excel spreadsheet.   The calculation included the employer contributions.  I compounded the interest at 5% (Future Value Calculator for Single Payment-the annual contribution).  The results were enough money contributed to last 13 years.  But that calculation was made the year after I retired.  Since then my monthly SS income has increased.  As the increases continue my contributions may be consumed in ten years.

With growing numbers of people living into their 80s and 90s where will the money come from to pay their SS checks?  My guess is it will come from the general revenue of the United States.  That is the reason that chained CPI is inevitable as is a later retirement age.

The 1% aren’t like the rest of us

This Op-Ed from the Los Angeles Times is really worth the read.   I admit to being part of the 47% that Mitt Romney mocked.  The findings of this survey confirm what I always knew.

Monopoly Game Box

The ultra-rich share few of the priorities of most Americans, but their access to policymakers is greater, a study finds.

By Benjamin I. Page and Larry M. Bartels

March 22, 2013

Over the last two years, President Obama and Congress have put the country on track to reduce projected federal budget deficits by nearly $4 trillion. Yet when that process began, in early 2011, only about 12% of Americans in Gallup polls cited federal debt as the nation’s most important problem. Two to three times as many cited unemployment and jobs as the biggest challenge facing the country.

So why did policymakers focus so intently on the deficit issue? One reason may be that the small minority that saw the deficit as the nation’s priority had more clout than the majority that didn’t.

We recently conducted a survey of top wealth-holders (with an average net worth of $14 million) in the Chicago area, one of the first studies to systematically examine the political attitudes of wealthy Americans. Our research found that the biggest concern of this top 1% of wealth-holders was curbing budget deficits and government spending. When surveyed, they ranked those things as priorities three times as often as they did unemployment — and far more often than any other issue.

If the concerns of the wealthy carry special weight in government — as an increasing body of social scientific evidence suggests — such extreme differences between their views and those of other Americans could significantly skew policy away from what a majority of the country would prefer. Our Survey of Economically Successful Americans was an attempt to begin to shed light on both the viewpoints and the political reach of the very wealthy.

While we had no way to measure directly the political influence of those surveyed, they did report themselves to be highly active politically.

Two-thirds of the respondents had contributed money (averaging $4,633) in the most recent presidential election, and fully one-fifth of them “bundled” contributions from others. About half recently initiated contact with a U.S. senator or representative, and nearly half (44%) of those contacts concerned matters of relatively narrow economic self-interest rather than broader national concerns. This kind of access to elected officials suggests an outsized influence in Washington.

On policy, it wasn’t just their ranking of budget deficits as the biggest concern that put wealthy respondents out of step with other Americans. They were also much less likely to favor raising taxes on high-income people, instead advocating that entitlement programs like Social Security and healthcare be cut to balance the budget. Large majorities of ordinary Americans oppose any substantial cuts to those programs.

While the wealthy favored more government spending on infrastructure, scientific research and aid to education, they leaned toward cutting nearly everything else. Even with education, they opposed things that most Americans favor, including spending to ensure that all children have access to good-quality public schools, expanding government programs to ensure that everyone who wants to go to college can do so, and investing more in worker retraining and education.

The wealthy opposed — while most Americans favor — instituting a system of national health insurance, raising the minimum wage to above poverty levels, increasing the Earned Income Tax Credit and providing a “decent standard of living” for the unemployed. They were also against the federal government helping with or providing jobs for those who cannot find private employment.

Unlike most Americans, wealthy respondents opposed increased regulation of large corporations and raising the “cap” that exempts income above $113,700 from the FICA payroll tax. And unlike most Americans, they oppose relying heavily on corporate taxes to raise revenue and oppose taxing the rich to redistribute wealth.

Some of the differences between the political views of the wealthy and other Americans may be explained by differences in the two groups’ economic experiences and self-interest. The wealthy are likely to have better information about the costs of government programs (for which they pay a lot of taxes) than about the benefits of those programs. They don’t usually have to rely on Social Security, for example, let alone food stamps or unemployment insurance.

Another possibility is that the wealthy — who tend to be highly educated, well informed and committed to charitable giving — seek the common good as they see it, and in fact know better than average Americans what sorts of policies would benefit us all. On the issue of federal deficits, for example, the public has come to see government debt as an increasingly important problem over the last two years, reducing the gulf between their views and those of the wealthy. Is that because the wealthy were ahead of the curve, or because their concern helped stimulate a steady drumbeat of deficit alarmism in the media and in Washington?

Our pilot study included a relatively small number of wealthy citizens, and they were all from a single metropolitan area. A larger-scale national study is needed to pin down more precisely the views of wealthy Americans about public policy. We need to understand how they formed the preferences they have, and how wealthy people from different regions, industries, and social backgrounds differ in their political views and behavior. We also need to understand more about their political clout.

Our initial results suggest the wealthy have very different ideas than other Americans on a variety of policy issues. If their influence is far greater than that of ordinary people, what does that mean for American democracy?

Benjamin I. Page is a political science professor at Northwestern University and co-author of “Class War? What Americans Really Think About Economic Inequality.” Larry M. Bartels is a political science professor at Vanderbilt University and author of “Unequal Democracy: The Political Economy of the New Gilded Age.”

// Copyright © 2013, Los Angeles Times

We Are Too Big to Fail!

The Senate passed the $700 billion bank bailout bill on October 3 2008. The guts of the bill was the same as the three-page document submitted on September 21 2008, by Treasury Secretary Henry Paulson. Paulson had asked Congress to approve a $700 billion bailout to buy mortgage-backed securities that were in danger of defaulting. By doing so, Paulson wanted to take these debts off the books of the banks, hedge funds and pension funds that held them. The goal was to instill confidence in the functioning of the global banking system, which had narrowly avoided collapse.

Then came the annual bank stress tests.  The official name is Comprehensive Capital Analysis and Review, or CCAR.  The results of these tests would be to identify those banks and associated companies that were adequately capitalized. Those not having sufficient funds would be required to take action to resolve the issue.  The test is required for all banking institutions with $50 billion in total capital assets.

No banks were split apart and nothing was done to confront the fact that the four largest banking organizations overwhelmingly impact the entire nation.

Largest banks and thrifts in US by total assets

Total                 Total

Company                         City, State                 assets            deposits

JPMorgan Chase & Co.        New York, NY            2,250.8          1,127.8

Bank of America Corp.        Charlotte, NC             2,129.0           1,033.0

Citigroup Inc.                      New York, NY          1,873.9              865.9

Wells Fargo & Co.               San Francisco, CA      1,313.9             920.1

If any of these banks failed the United   States would step in to protect their well being.

Federal Reserve press release dated March 14, 2013.  “The Federal Reserve on Thursday announced it has approved the capital plans of 14 financial institutions in the Comprehensive Capital Analysis and Review (CCAR). Two other institutions received conditional approval, while the Federal Reserve objected to the plans of two firms.”

As to breaking apart the behemoths, not a word.